用N-Gram模型在莎士比亚文集中训练word embedding
作者: PaddlePaddle
日期: 2022.5
摘要: N-gram 是计算机语言学和概率论范畴内的概念,是指给定的一段文本中N个项目的序列。N=1 时 N-gram 又称为 unigram,N=2 称为 bigram,N=3 称为 trigram,以此类推。实际应用通常采用 bigram 和 trigram 进行计算。本示例在莎士比亚文集上实现了trigram。
一、环境配置
本教程基于PaddlePaddle 2.3.0 编写,如果你的环境不是本版本,请先参考官网安装 PaddlePaddle 2.3.0。
import paddle

paddle.__version__
'2.3.0'
二、数据集&&相关参数
2.1 数据集下载
训练数据集采用了莎士比亚文集,点击下载后,保存为txt格式即可。
context_size设为2,意味着是trigram。embedding_dim设为256。
!wget https://ocw.mit.edu/ans7870/6/6.006/s08/lecturenotes/files/t8.shakespeare.txt
# 文件路径
path_to_file = "./t8.shakespeare.txt"
test_sentence = open(path_to_file, "rb").read().decode(encoding="utf-8")

# 文本长度是指文本中的字符个数
print("Length of text: {} characters".format(len(test_sentence)))
Length of text: 5458199 characters
2.2 数据预处理
因为标点符号本身无实际意义,用string库中的punctuation,完成英文符号的替换。
from string import punctuation

process_dicts = {i: "" for i in punctuation}
print(process_dicts)

punc_table = str.maketrans(process_dicts)
test_sentence = test_sentence.translate(punc_table)
{'!': '', '"': '', '#': '', '$': '', '%': '', '&': '', "'": '', '(': '', ')': '', '*': '', '+': '', ',': '', '-': '', '.': '', '/': '', ':': '', ';': '', '<': '', '=': '', '>': '', '?': '', '@': '', '[': '', '\\': '', ']': '', '^': '', '_': '', '`': '', '{': '', '|': '', '}': '', '~': ''}
由于词表中的长尾效应,会降低模型训练的速度与精度。因此取词频前2500的单词作为词表,如果不在词表中的单词都用 '
test_sentence_list = test_sentence.lower().split()

word_dict_count = {}
for word in test_sentence_list:
    word_dict_count[word] = word_dict_count.get(word, 0) + 1

word_list = []
soted_word_list = sorted(
    word_dict_count.items(), key=lambda x: x[1], reverse=True
)
for key in soted_word_list:
    word_list.append(key[0])

word_list = word_list[:2500]
print(len(word_list))
2500
2.3 模型参数设置
设置模型训练常用的参数。
# 设置参数
hidden_size = 1024  # Linear层 参数
embedding_dim = 256  # embedding 维度
batch_size = 256  # batch size 大小
context_size = 2  # 上下文长度
vocab_size = len(word_list) + 1  # 词表大小
epochs = 2  # 迭代轮数
三、数据加载
3.1 数据格式
将文本被拆成了元组的形式,格式为(('第一个词', '第二个词'), '第三个词');其中,第三个词就是目标。
trigram = [
    [
        [test_sentence_list[i], test_sentence_list[i + 1]],
        test_sentence_list[i + 2],
    ]
    for i in range(len(test_sentence_list) - 2)
]

word_to_idx = {word: i + 1 for i, word in enumerate(word_list)}
word_to_idx["<pad>"] = 0
idx_to_word = {word_to_idx[word]: word for word in word_to_idx}

# 看一下数据集
print(trigram[:3])
[[['this', 'is'], 'the'], [['is', 'the'], '100th'], [['the', '100th'], 'etext']]
3.2 构建Dataset类 加载数据
用paddle.io.Dataset构建数据集,然后作为参数传入到paddle.io.DataLoader,完成数据集的加载。
import numpy as np


class TrainDataset(paddle.io.Dataset):
    def __init__(self, tuple_data):
        self.tuple_data = tuple_data

    def __getitem__(self, idx):
        data = self.tuple_data[idx][0]
        label = self.tuple_data[idx][1]
        data = np.array(list(map(lambda word: word_to_idx.get(word, 0), data)))
        label = np.array(word_to_idx.get(label, 0), dtype=np.int64)
        return data, label

    def __len__(self):
        return len(self.tuple_data)


train_dataset = TrainDataset(trigram)

# 加载数据
train_loader = paddle.io.DataLoader(
    train_dataset,
    return_list=True,
    shuffle=True,
    batch_size=batch_size,
    drop_last=True,
)
四、模型组网
这里用paddle动态图的方式组网。为了构建Trigram模型,用一层 Embedding 与两层 Linear 完成构建。Embedding 层对输入的前两个单词embedding,然后输入到后面的两个Linear层中,完成特征提取。
import paddle.nn.functional as F


class NGramModel(paddle.nn.Layer):
    def __init__(self, vocab_size, embedding_dim, context_size):
        super().__init__()
        self.embedding = paddle.nn.Embedding(
            num_embeddings=vocab_size, embedding_dim=embedding_dim
        )
        self.linear1 = paddle.nn.Linear(
            context_size * embedding_dim, hidden_size
        )
        self.linear2 = paddle.nn.Linear(hidden_size, vocab_size)

    def forward(self, x):
        x = self.embedding(x)
        x = paddle.reshape(x, [-1, context_size * embedding_dim])
        x = self.linear1(x)
        x = F.relu(x)
        x = self.linear2(x)
        return x
五、 方式1:基于高层API,完成模型的训练与预测
5.1 自定义Callback
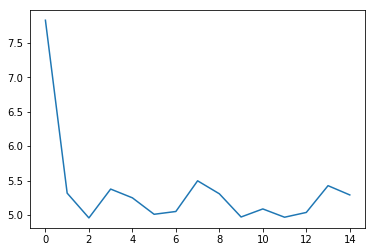
在训练过程中,有时需要根据模型训练过程中loss,打印loss下降曲线来调参。为了保存训练时每个batch的loss信息,需要自己定义Callback函数,完成模型训练时loss信息的记录。具体的方式如下:
# 自定义Callback 需要继承基类 Callback
class LossCallback(paddle.callbacks.Callback):
    def __init__(self):
        self.losses = []

    def on_train_begin(self, logs={}):
        # 在fit前 初始化losses,用于保存每个batch的loss结果
        self.losses = []

    def on_train_batch_end(self, step, logs={}):
        # 每个batch训练完成后调用,把当前loss添加到losses中
        self.losses.append(logs.get("loss"))


loss_log = LossCallback()
5.2 模型训练
完成组网与自定义Callback后,将模型用 Model 封装后,就可以用 Model.prepare()、Model.fit() 开始训练。
n_gram_model = paddle.Model(
    NGramModel(vocab_size, embedding_dim, context_size)
)  # 用 Model封装 NGramModel

# 模型配置
n_gram_model.prepare(
    optimizer=paddle.optimizer.Adam(
        learning_rate=0.01, parameters=n_gram_model.parameters()
    ),
    loss=paddle.nn.CrossEntropyLoss(),
)

# 模型训练
n_gram_model.fit(
    train_loader,
    epochs=epochs,
    batch_size=batch_size,
    callbacks=[loss_log],
    verbose=1,
)
The loss value printed in the log is the current step, and the metric is the average value of previous steps.
Epoch 1/2
step 3519/3519 [==============================] - loss: 5.3077 - 5ms/step
Epoch 2/2
step 3519/3519 [==============================] - loss: 5.0501 - 5ms/step
5.3 loss可视化
利用 matplotlib 工具,完成loss的可视化
# 可视化 loss
import matplotlib.pyplot as plt
import matplotlib.ticker as ticker

%matplotlib inline
log_loss = [loss_log.losses[i] for i in range(0, len(loss_log.losses), 500)]
plt.figure()
plt.plot(log_loss)
[<matplotlib.lines.Line2D at 0x7fbd234c2290>]

六、方式2:基于基础API,完成模型的训练与预测
6.1 自定义 train 函数
通过基础API,自定义 train 函数,完成模型的训练。
import paddle.nn.functional as F

losses = []


def train(model):
    model.train()
    optim = paddle.optimizer.Adam(
        learning_rate=0.01, parameters=model.parameters()
    )
    for epoch in range(epochs):
        for batch_id, data in enumerate(train_loader()):
            x_data = data[0]
            y_data = data[1]
            predicts = model(x_data)
            loss = F.cross_entropy(predicts, y_data)
            loss.backward()
            if batch_id % 500 == 0:
                losses.append(loss.numpy())
                print(
                    "epoch: {}, batch_id: {}, loss is: {}".format(
                        epoch, batch_id, loss.numpy()
                    )
                )
            optim.step()
            optim.clear_grad()


model = NGramModel(vocab_size, embedding_dim, context_size)
train(model)
epoch: 0, batch_id: 0, loss is: [7.8221755]
epoch: 0, batch_id: 500, loss is: [5.108782]
epoch: 0, batch_id: 1000, loss is: [5.0642047]
epoch: 0, batch_id: 1500, loss is: [5.216312]
epoch: 0, batch_id: 2000, loss is: [5.1552796]
epoch: 0, batch_id: 2500, loss is: [5.2444506]
epoch: 0, batch_id: 3000, loss is: [5.312122]
epoch: 0, batch_id: 3500, loss is: [5.254105]
epoch: 1, batch_id: 0, loss is: [5.1172333]
epoch: 1, batch_id: 500, loss is: [5.2416806]
epoch: 1, batch_id: 1000, loss is: [5.0289545]
epoch: 1, batch_id: 1500, loss is: [5.1003613]
epoch: 1, batch_id: 2000, loss is: [5.1481485]
epoch: 1, batch_id: 2500, loss is: [5.0824614]
epoch: 1, batch_id: 3000, loss is: [5.156294]
epoch: 1, batch_id: 3500, loss is: [5.105474]
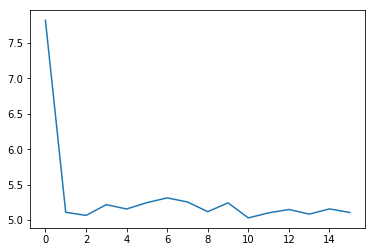
6.2 loss可视化
通过可视化loss的曲线,可以看到模型训练的效果。
import matplotlib.pyplot as plt
import matplotlib.ticker as ticker

%matplotlib inline

plt.figure()
plt.plot(losses)
[<matplotlib.lines.Line2D at 0x7fbcc1adf3d0>]

6.3 预测
用训练好的模型进行预测。
import random


def test(model):
    model.eval()
    # 从最后10组数据中随机选取1个
    idx = random.randint(len(trigram) - 10, len(trigram) - 1)
    print(
        "the input words is: " + trigram[idx][0][0] + ", " + trigram[idx][0][1]
    )
    x_data = list(map(lambda word: word_to_idx.get(word, 0), trigram[idx][0]))
    x_data = paddle.to_tensor(np.array(x_data))
    predicts = model(x_data)
    predicts = predicts.numpy().tolist()[0]
    predicts = predicts.index(max(predicts))
    print("the predict words is: " + idx_to_word[predicts])
    y_data = trigram[idx][1]
    print("the true words is: " + y_data)


test(model)
the input words is: of, william
the predict words is: shakespeare
the true words is: shakespeare